SELL BUY
Foreign ratio Market Cap.
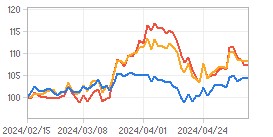
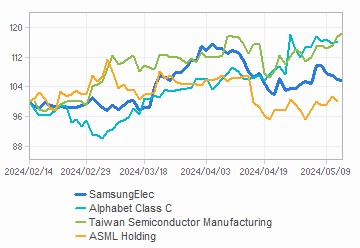
SamsungElec KOSPI Electrical Equipment& Electronics KOSPI
-
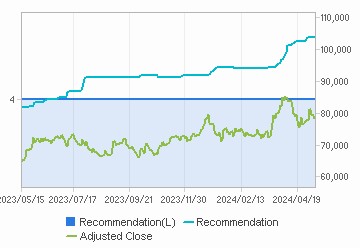
Closing Price, Insider Trade
60,200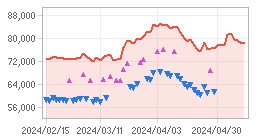
-
Foreign ratio, Market Cap.
49.64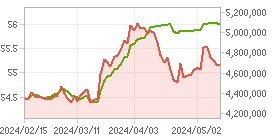
-
-26.41
Close/Change |
60,200/ +400 | Trading Volume |
13,650,991 |
|---|---|---|---|
52 Wk. High/Low |
87,800/ 49,900 | Trading Value(100mn) |
8,275 |
% Change(1M/ 3M/ 6M/ 1Y) |
+7.12/ +2.38/ +13.16/ -26.41 | Foreign ratio |
49.64 |
Market Cap(+to be listed, 100mn) |
3,972,425 | Beta(1Y) |
1.15576 |
Market Cap(Comm.,100mn) |
3,563,622 | Par Value |
100 |
Issue Shares(Total) |
5,919,637,922/ 815,974,664 | Free Float Shares/Rate(Comm.) |
4,498,296,905 / 75.99 |
| Date of Scheduled Disclosure | Consensus(Oper.Income, 100mn) | Compared to consensus (3M, %) | YoY Growth (%) |
|---|---|---|---|
| Undecided | 65,271 | +4.59 | -37.50 |
| Shareholders | Common | Ownership(%) | Last Update Date |
|---|---|---|---|
| 1,192,886,520 | 20.15 | 2025/06/16 | |
국민연금공단 | 458,637,667 | 7.75 | 2022/08/16 |
| 300,391,061 | 5.07 | 2019/01/28 | |
자사주 | 42,892,472 | 0.72 | 2025/05/26 |
| Shareholders Type | # of holders | Common | Ownership(%) | Last Update Date |
|---|---|---|---|---|
Major Holders | 1 | 1,192,886,520 | 20.15 | 2025/06/16 |
Holders over 10% | ||||
Holders over 5% | 2 | 759,028,728 | 12.82 | 2022/08/16 |
Officers (under 5%) | 441 | 2,571,873 | 0.04 | 2025/03/17 |
Treasury stocks | 1 | 42,892,472 | 0.72 | 2025/05/26 |
ESPPs |
| KIS | KR | NICE |
|---|---|---|
| No Results Found | ||
| KIS | KR | NICE |
|---|---|---|
| AAA [2004/05/25] | AAA [2004/06/17] | AAA [2004/06/01] |
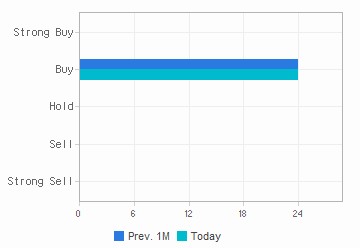
| Recommendation | Target Price | EPS | PER | Number of Estimates |
|---|---|---|---|---|
| 4.0 | 75,600 | 4,624 | 13.0 | 25 |
fnguide.com
The information provided by FnGuide is obtained from reliable sources and information, but its accuracy or completeness cannot be guaranteed and is subject to change over time. Therefore, for any errors or omissions of information, FnGuide or the company providing data to FnGuide is not legally liable for the results. All content is copyrighted by FnGuide, and if you use it without prior permission or make a database, you may be liable for civil and criminal reasons.
웹 접근성 우수사이트 인증마크(WA인증마크)